

As mentioned in the previous article, Portugal wasn’t the destination, it was just a detour. That Sunday began early, scanning Porto’s Bolhão district between 4 and 7 AM, while the streets were almost empty and the city slowly woke up. By noon, I was on the road again, heading north into Galicia.
WeWifi had been asked to perform a wireless health check at an agricultural facility involved in the production of phytosanitary products. The work would start the next day, but that evening, I had time for a scan in the neighborhood where I was staying. Coia, in the southwest of Vigo, is a former village that has grown into a residential district with apartment blocks, green spaces, and a mix of local amenities.
By 9 PM, I was walking again, iPad in hand, Sidekick on my hip. Cafés were still open, bars had a bit of evening noise, and a few people were out walking their dogs. Despite the long day, I covered about five kilometers across roughly 100,000 square meters of city blocks, recording thousands of signals drifting through the air.
Still, you might ask what the point is. No one commissions these Wi-Fi scans from us. We do them because we believe the best way to demonstrate our expertise is not just by talking about it, but by actually going out there and doing the work. Each survey gives us real data, fresh insights, and a clearer picture of how Wi-Fi behaves in the places people actually live, work, and visit. When you’re responsible for networks, there’s no room for empty claims. You need practical knowledge and proven results. These surveys are our way of sharing both, openly, with anyone who needs them.
So here it is. This is what we found in Coia, on a Sunday night.
Total Broadcasts Captured
The signals we recorded came from a mix of hardware types. These included home routers, wall-mounted access points, mobile hotspots, in-car Wi-Fi units, and even IoT devices with embedded radios. For simplicity, we refer to all of these as broadcasting devices.
As in previous articles, we distinguish between physical broadcasting devices and the SSIDs (hidden or visible network names) they transmit. A single device can operate on multiple frequency bands and may broadcast several network names on each, often resulting in more SSIDs than underlying hardware. Throughout this report, we shift between SSID-level and device-level observations to provide a full view of the local wireless landscape.
In total, we detected 9,743 SSID broadcasts during the scan. Of these, 8,260 were visible and 1,483 were hidden. The 15 percent share of hidden networks is the lowest among all our recorded surveys so far, though still consistent with what we expect in dense residential environments.
These SSIDs were transmitted by 6,276 individual broadcasting devices, many of which operated across multiple frequency bands. The distribution of physical devices was as follows:
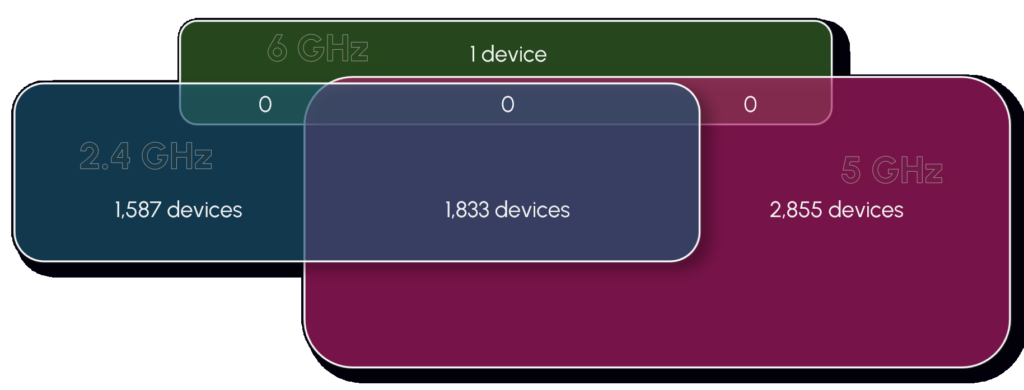
This layered use of spectrum reflects the gradual, often fragmented adoption of newer Wi-Fi technologies. In Coia, dual-band configurations are common, but tri-band equipment remains absent, and 6 GHz usage is virtually nonexistent.
Wi-Fi Technology Versions
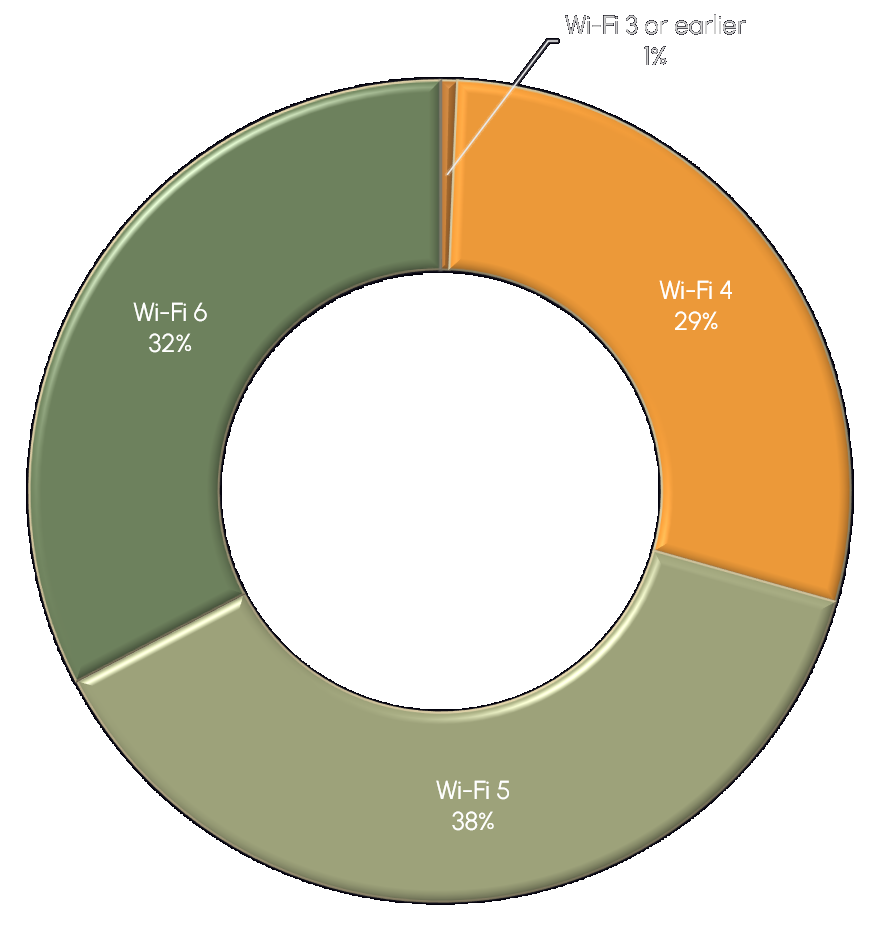
The three dominant standards showed a relatively balanced distribution. Wi-Fi 5 was the most common, followed closely by Wi-Fi 6, while Wi-Fi 4 remained widespread. Only about one percent of networks used technologies classified as Wi-Fi 3 or earlier, most likely from legacy or unmanaged devices. Fortunately, these outdated systems are becoming increasingly rare, as newer hardware gradually replaces them across most deployments.
Next-generation standards were virtually absent. Only one SSID used Wi-Fi 6E, and none were seen with Wi-Fi 7. This reflects a pattern we have seen elsewhere: support for newer technologies may exist, but actual adoption lags behind, especially in residential areas like this one, where enterprise presence is limited. The 6 GHz band still plays no real role in Coia’s wireless landscape.
Channel Saturation
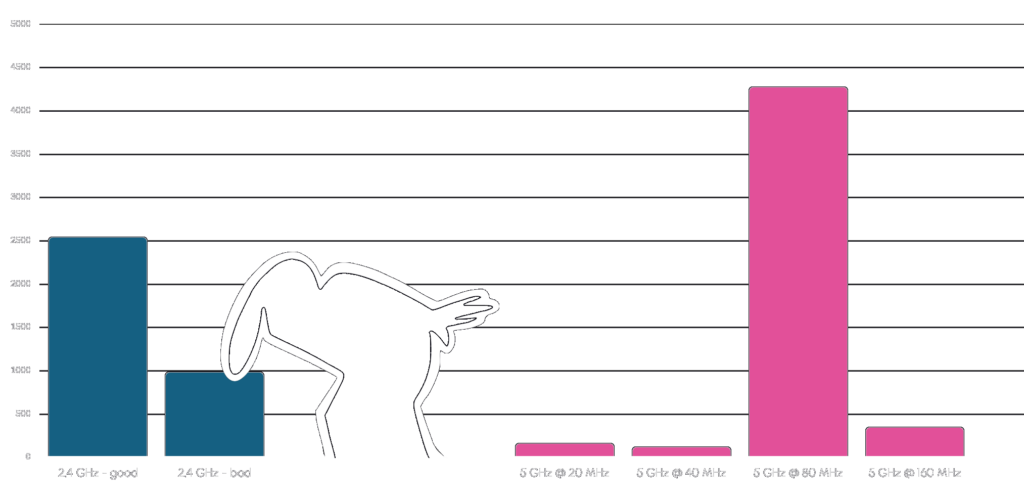
On the 2.4 GHz band, most devices followed industry best practices by operating on channels 1, 6 or 11 with a 20 MHz channel width. This group accounted for nearly three-quarters of all 2.4 GHz devices in the area. Still, more than 900 devices deviated from these norms by using overlapping channels or 40 MHz widths.
Among the misconfigured setups, the overwhelming majority involved incorrect channel selection while maintaining the standard 20 MHz width. This suggests users manually changed the channel, perhaps in an attempt to avoid interference, without understanding how overlapping channels degrade performance. A much smaller share of devices used 40 MHz widths, indicating a more adventurous subset of users willing to adjust settings they likely did not fully grasp. Only a small fraction changed the channel width alone, showing that few are bold enough to tweak advanced options without also tampering with the channel itself.
The 5 GHz band showed a clear preference for speed. Over 4,200 devices operated with 80 MHz channel widths, which provide higher throughput but also increase the likelihood of spectral congestion. Smaller numbers of devices used narrower 20 or 40 MHz channels, and 300 used the widest available 160 MHz width, likely reflecting out-of-the-box configurations on newer routers rather than conscious optimization.
The 5 GHz band in Coia revealed a relatively even distribution of channel usage, especially compared to other cities we have surveyed. Three lower-frequency channels (36, 52 and 100) stood out with significantly higher device counts, but beyond these, the spectrum was shared in a surprisingly balanced way. While the lower and midrange channels saw steady activity, the upper end of the band, particularly channels above 120, remained almost entirely unused. This pattern stands in contrast to Porto, where usage was more fragmented, and to Edinburgh, where the upper channels were also neglected but the overall distribution was far more uneven.
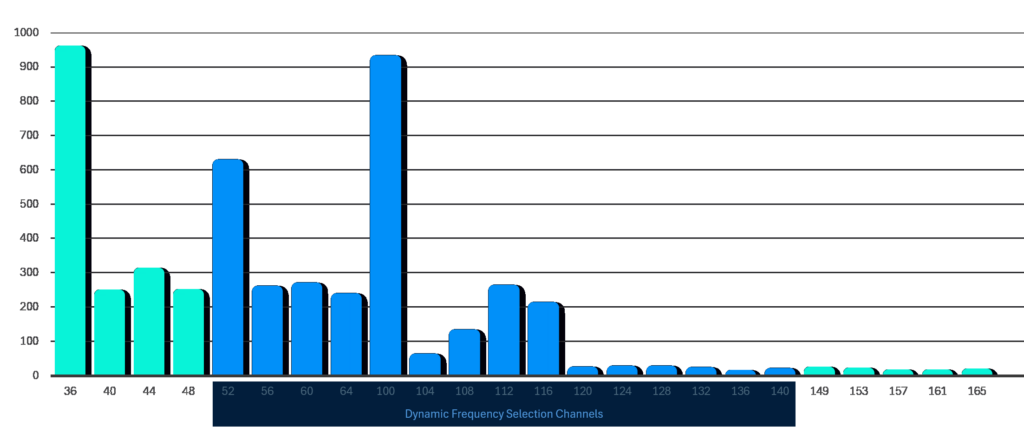
Only one device was detected operating in the 6 GHz band, reinforcing the trend seen in other residential districts: while support for tri-band configurations is slowly increasing, real-world adoption remains extremely rare. Still, that one device made the most of it: a full 160 MHz channel width, all to itself. And why not? The entire airspace of the neighborhood was there for the taking.
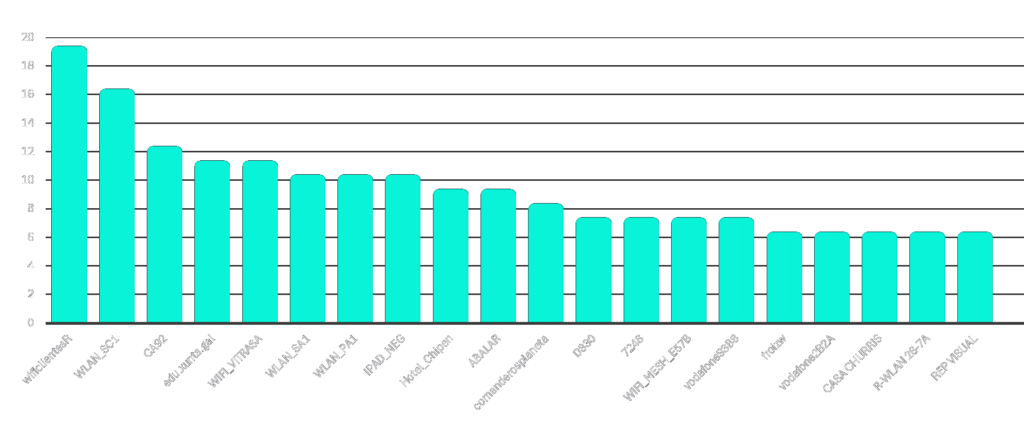
SSID Naming Patterns
Vigo’s Coia district presented a highly diverse SSID landscape, with no single network name appearing more than 19 times. This lack of dominant identifiers suggests a decentralized wireless environment where no large institution, public infrastructure, or service provider visibly overshadows the rest. Instead, the network names reflect a mosaic of small-scale deployments: residential routers, small businesses, and localized infrastructure, each contributing just a few entries to the total.
Of the 9,743 SSIDs detected during the survey, 8,260 were visible and 1,483 were hidden. This makes hidden SSIDs just over 15 percent of the total, the lowest proportion recorded in any of our surveys so far. Such visibility may point to a combination of default configurations, limited user customization, and a general lack of emphasis on privacy or obscurity in local network practices.
Service provider influence was still evident in naming patterns. Movistar led the field with over 2,000 SSIDs tied to its naming schemes, followed by Vodafone with around 700. Orange and Jazztel made only marginal appearances, together accounting for just 10 SSIDs. This distribution reflects the regional strength of Spain’s major ISPs and underlines Movistar’s dominant role in the Galician residential broadband market. Despite their prevalence, most of these ISP-based SSIDs followed predictable patterns, often incorporating router IDs or alphanumeric suffixes. This further emphasizes the low level of user customization across the dataset.
SSID-wise, Coia wasn’t exactly a playground of creativity. Most network names stuck to predictable templates: default ISP tags, apartment numbers, or vague abbreviations. But just when it seemed the entire district had collectively given up on imagination, a few rebel SSIDs popped up. On one end of the neighborhood, someone broadcasted VIRUS-2G and VIRUS-5G, which might be the fastest way to keep freeloaders off your Wi-Fi. Not to be outdone, the other side of district answered with NODOVIRUS5 and the slightly more ominous NODOVIRUS666. Are they trolling? Paranoid? Just bored? We may never know, but at least they gave us something to smile at.
Who’s Powering Coia’s Wi-Fi
Coia’s wireless landscape is driven overwhelmingly by residential-grade infrastructure. The most common manufacturers include ZTE, MitraStar, Askey, Sercomm, Arcadyan, and TP-Link, all brands closely tied to ISP-issued hardware in Spanish homes. These devices are typically bundled with broadband packages, preconfigured and rarely customized, which explains both their technical consistency and occasional misconfiguration.
Further down the list, we find Sagemcom, Vantiva, and Comtrend, all of which have a strong presence in European consumer markets. Though less dominant, brands like Zyxel, ARRIS, and DWnet also contribute to the district’s network ecosystem, reinforcing the pattern of mass-deployed, plug-and-play hardware.
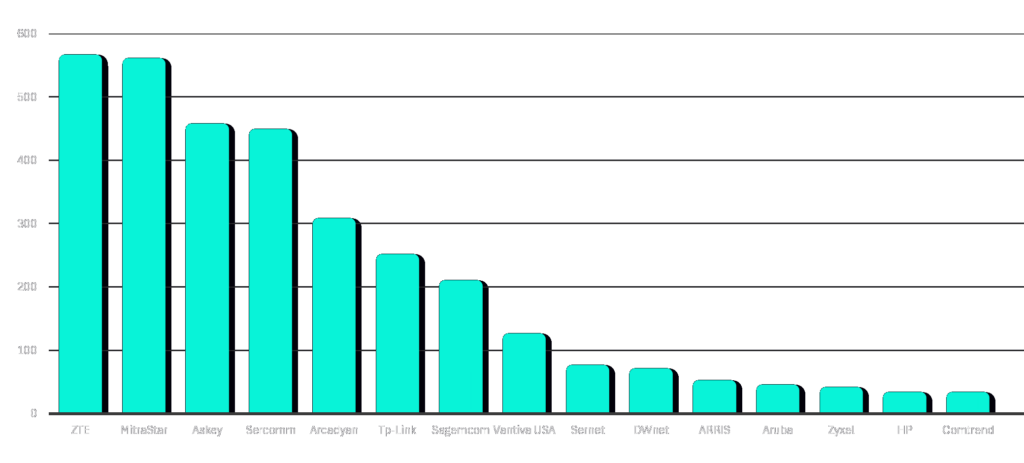
Enterprise-grade deployments were relatively rare. Only a handful of professional manufacturers appeared in the data, including Aruba, HP, Ubiquiti, Cisco Meraki, Lancom, Fortinet, and Cisco. These are likely found in schools, clinics, government buildings, and a few commercial hotspots scattered across the district. In total, enterprise vendors accounted for fewer than 100 of the more than 6,000 broadcasting devices observed, which reflects the residential character of the area more than any technological lag.
The dominance of consumer hardware suggests a network environment shaped less by IT policy and more by ISP defaults, user convenience, and out-of-the-box settings. It’s a snapshot of how most people actually connect.
Closing Thoughts
Coia turned out to be even more uniform than we expected. Given the character of the neighborhood, we anticipated a dominance of SOHO-grade hardware, but their overwhelming presence still exceeded our expectations. The technologies and naming conventions reflected a network landscape shaped more by defaults and repetition than by customization or innovation.
We knew 6 GHz adoption would be low, but its near-total absence still surprised us. What caught us even more off guard was the overwhelming preference for 80 MHz channels on 5 GHz, and the relatively even distribution across lower-frequency 5 GHz channels. That’s something we hadn’t seen in previous cities.
Next up is Paris.
What’s more, we’re taking requests. If there’s a place you think we should scan next, let us know, and we might just walk through with our spectrum analyzer.
Follow us on LinkedIn or sign up for our newsletter to get the next one straight to your inbox. And if you’d like to see what’s going on inside your network, we’re just a message away.