
The Liverpool survey took place on 17 October 2024, under circumstances that could only be described as truly British: relentless rain, grey skies, and local flooding. Across the river in Runcorn, floodwaters had overtaken parts of the town, including a large warehouse where we were scheduled to conduct a survey the following day. When we arrived on 18 October, the water had receded, but the aftermath was plain to see. Delivery piles that had been delayed by the flooding now towered into miniature mountains, cluttering walkways and slowing every step we took. Still, flexible working is part of our DNA, and the site survey carried on without a hitch, weaving between crates and packages like an improvised obstacle course.
Moments like this highlight the variety of environments we encounter. From shiny offices and busy airports to schools, hotels, and even flood-affected logistics centres, we bring wireless expertise wherever it is needed. It keeps us sharp, keeps us moving, and certainly keeps things interesting.
Liverpool’s Cavern Quarter offered a different kind of atmosphere. Best known as the birthplace of the Mersey Beat movement and a cornerstone of British pop culture, this lively neighborhood shaped the soundtrack of a generation. It was here that the Beatles took their first steps toward global fame, playing countless gigs at the Cavern Club. The energy born here spread far beyond the banks of the Mersey, influencing the global pop industry and changing the course of modern music.
For someone who grew up with the Beatles’ music, walking these streets was more than just another survey stop. It felt like a tribute to the very spirit that had once shaken the world. Inspired by that legacy, we set out to trace the invisible waves that now pulse through Liverpool’s most storied cultural quarter.
Total Broadcasts Captured
The signals we captured in Liverpool’s Cavern Quarter came from a mix of sources, from home and office routers to public Wi-Fi points and mobile hotspots. For simplicity, we refer to all of these as broadcasting devices.
One device can broadcast multiple Wi-Fi networks (SSIDs) across different frequency bands, so the number of SSIDs detected always exceeds the number of devices. Throughout this article, we alternate between device-level and SSID-level analysis to offer a complete view of the environment.
In total, we detected 1,318 broadcasting devices, producing 4,524 SSIDs. Of these, 3,334 were visible to users, while 1,190 were hidden from casual view.
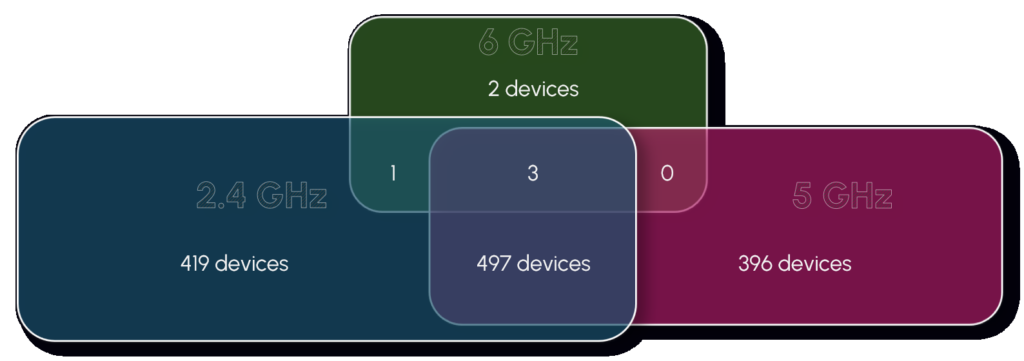
Breaking it down by frequency, 917 devices operated on 2.4 GHz, 896 on 5 GHz, and only 6 on the new 6 GHz band, with many devices active on more than one frequency. The limited use of 6 GHz once again highlights how early we are in the adoption curve for next-generation Wi-Fi.
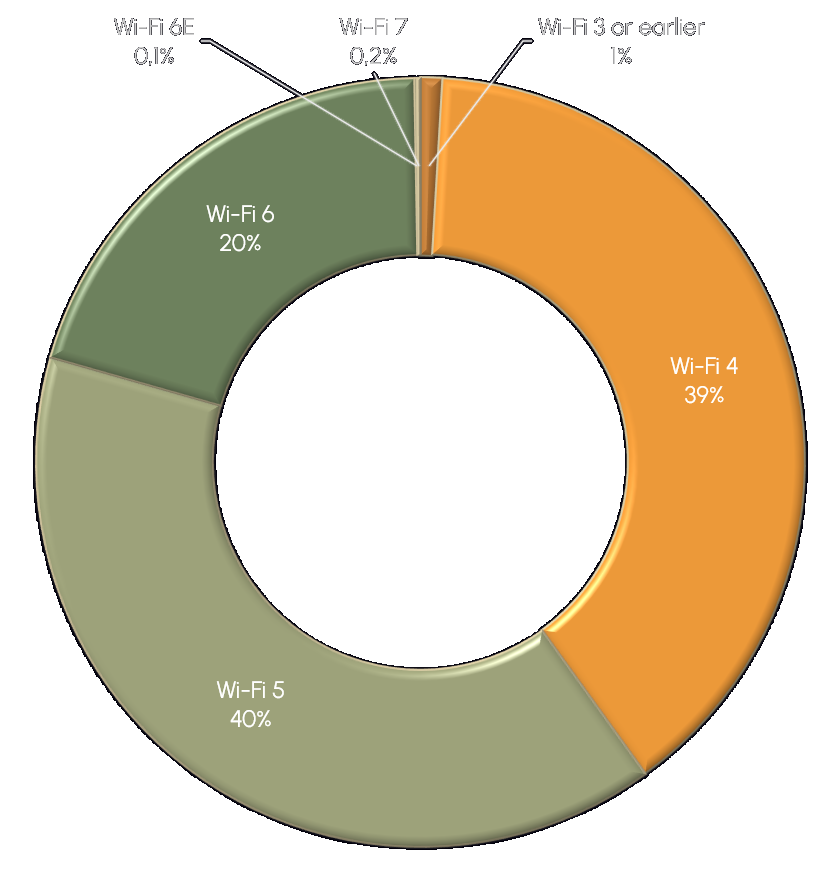
Wi-Fi Technology Versions
In Liverpool’s Cavern Quarter, Wi-Fi 5 led the field, followed closely by Wi-Fi 4, with Wi-Fi 6 also making a strong showing. While older technologies remain widespread, the presence of newer standards is clearly growing, especially in more recently upgraded environments.
Although we surveyed a slightly smaller area here, approximately 30,000 square meters compared to 40,000 square meters in Edinburgh, the environments were similarly urban, although Edinburgh leaned more toward business and retail, while Liverpool’s Cavern Quarter had a stronger entertainment and tourism focus. Despite the smaller area, we detected a slightly higher number of 6 GHz capable devices, including both Wi-Fi 6E and early Wi-Fi 7 networks, suggesting that next-generation Wi-Fi technologies are beginning to find their place even in lively, high-traffic city districts.
Meanwhile, a small fraction of networks still operated on legacy technologies predating Wi-Fi 4, a reminder that older hardware can linger long after new standards are introduced.
Channel Saturation
On the 2.4 GHz band, most broadcasting devices followed best practices by operating on one of the non-overlapping channels (1, 6, or 11) with a 20 MHz channel width. A substantial number, however, deviated from this standard, using either overlapping channels or wider 40 MHz setups, both of which can increase interference risks in dense urban areas.
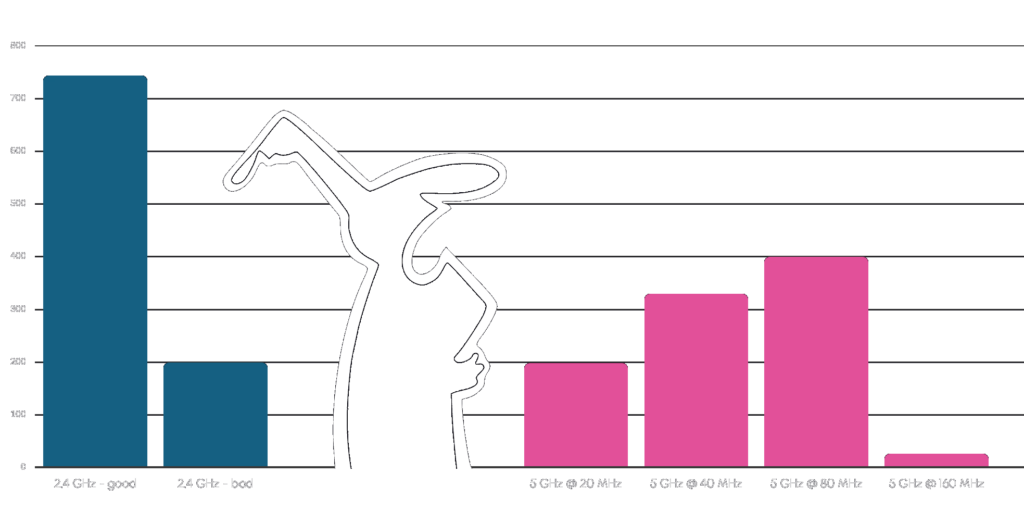
The 5 GHz band showed a broad variety of channel widths. The majority of devices favored wider 80 MHz configurations, while a significant portion operated with 40 MHz channels, and a smaller group maintained the more conservative 20 MHz width. Only a handful of devices used 160 MHz, indicating that performance-optimized configurations remain relatively rare even in busy, centrally located districts. Interestingly, these patterns on both the 2.4 GHz and 5 GHz bands closely mirrored the ratios we observed earlier in Edinburgh, suggesting common configuration habits across different urban centers. And the deeper we looked, the more the parallels kept coming.
Channel usage on the 5 GHz band was once again heavily concentrated in the lower UNII-1 channels. Usage tapered off across the mid-band DFS channels, which saw moderate adoption, and dropped even further toward the higher UNII-3 frequencies. The resemblance to Edinburgh was hard to ignore, even a little surreal.
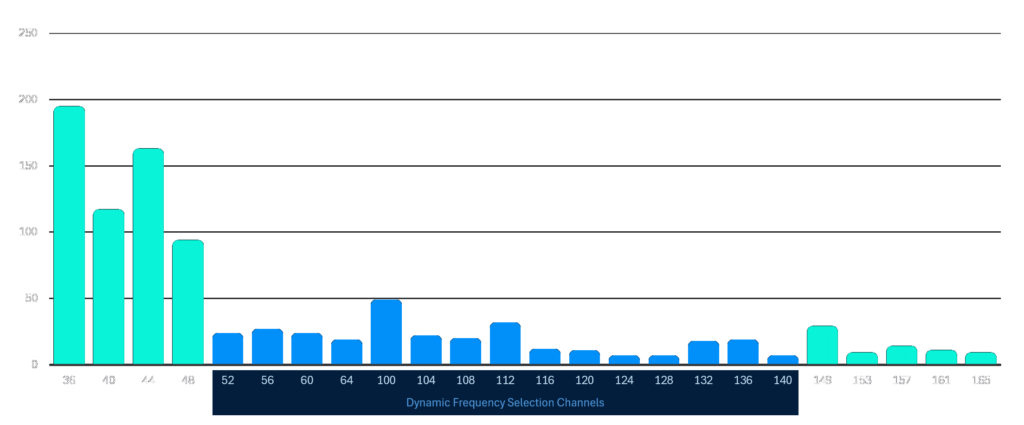
Channel usage in Edinburgh on the 5 GHz band
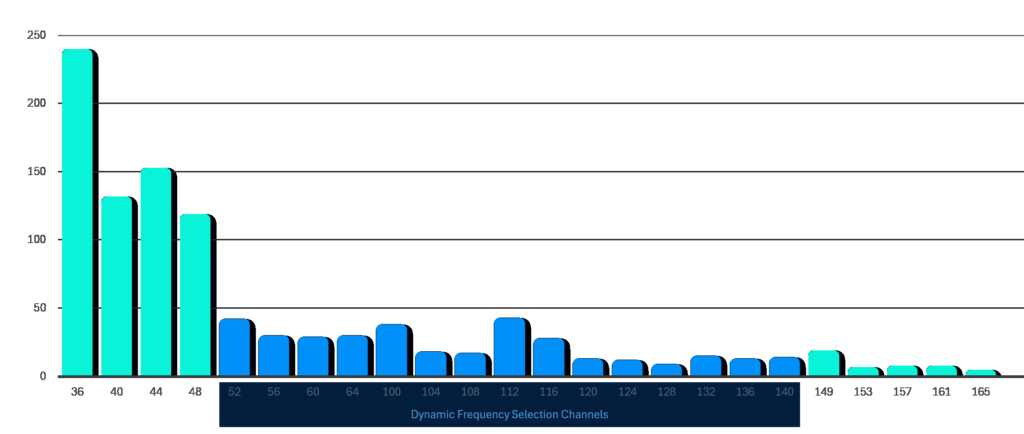
Channel usage in Liverpool on the 5 GHz band
Different city, different survey, yet the charts above look nearly like carbon copies of each other.
On the 6 GHz band, adoption remained very limited. Only six devices were detected operating in this range, all using 160 MHz channel widths. While their presence is still minimal, it points toward the slow but steady integration of 6 GHz capabilities into real-world deployments.
SSID Naming Patterns
About one quarter of all detected SSIDs were hidden, while the rest revealed a clear mix of residential, business, and public access networks. The top 20 visible SSIDs reflected the area’s commercial and tourist-driven character, with a strong showing from local businesses and hospitality venues. Leading the list was “JSM,” followed by names tied to apartments, hotels, and bars such as “Happy Days Apartments,” “CenturyBuildings,” and “McCooleys Staff.”
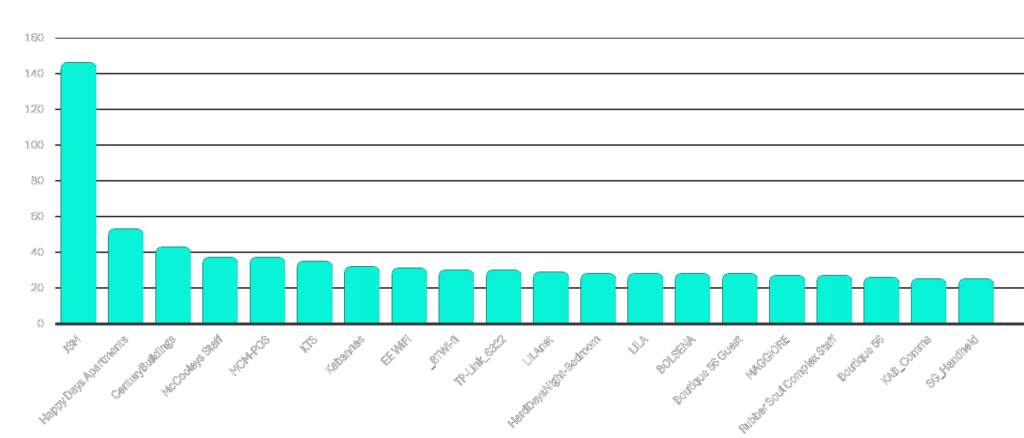
Humorous or personalized SSIDs were rare. Unlike in some residential surveys, we did not encounter pun-The area’s musical heritage was impossible to miss even in the wireless landscape. Numerous SSIDs referenced the Beatles or the Mersey Beat era, not just as cultural nods, but as part of a deliberate branding strategy. Names like “HardDaysNight-Bedroom,” “Rubber Soul Complex Staff,” “Revolver Staff”, “HarrisonsCustomers”, “EleanorRigbyApts 5G”, and a range of Cavern-themed networks appeared across the scan. Some were among the most frequently broadcasted SSIDs, others tied to smaller venues or private back-end systems, weaving the city’s musical identity into its digital infrastructure.
When it comes to networks issued by ISPs, BT and EE led the field, each accounting for nearly fifty SSIDs. Three and Sky followed with a notable presence, while Hyperoptic appeared with fewer networks, reflecting its more specialized coverage. Vodafone networks were rare, and no Virgin Media networks were detected during the survey.
Who’s Powering Liverpool’s Wi-Fi?
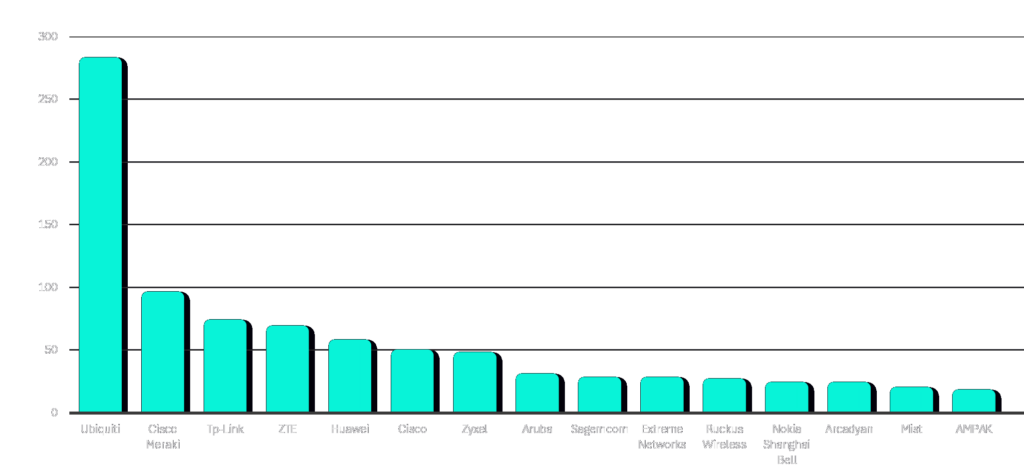
Among the devices where a manufacturer could be identified, the Cavern Quarter’s wireless environment leaned strongly toward enterprise-grade hardware, though not exclusively. Ubiquiti led the field by a wide margin, with Cisco Meraki, Cisco, Aruba, Extreme Networks, and Ruckus Wireless also making significant appearances. These brands, typically associated with professional-grade deployments, suggested a wireless fabric built to handle high user density and demanding public environments.
However, the presence of consumer-focused manufacturers was also notable. TP-Link, ZTE, Huawei, and others powered a substantial share of smaller networks, guest services, and residential-style setups scattered through the district’s apartments, hotels, and smaller businesses.
Overall, the Cavern Quarter’s wireless ecosystem reflected the area’s unique mix of needs. Robust, high-performance infrastructure dominated the busiest venues, while cost-effective solutions filled the gaps where full-scale enterprise deployments were not strictly necessary.
Closing Thoughts
Liverpool’s Cavern Quarter provided a vivid snapshot of how wireless networks evolve in lively urban environments. Despite the area’s historic character and heavy tourist traffic, the wireless infrastructure showed a strong tilt toward enterprise-grade solutions, complemented by the practical presence of consumer-grade equipment where needed.
Patterns we observed here closely resembled those seen in Edinburgh, from channel usage preferences to the balance between modern and legacy technologies. Even across different cities and slightly different environments, the wireless landscape followed strikingly similar rhythms.
Above all, the Cavern Quarter’s networks reflected the district’s unique spirit. A place where music once changed the world now pulses with thousands of invisible signals, blending the echoes of the past with the demands of a connected present. Among those signals, we noticed a recurring theme that was unmistakably Liverpudlian. Networks named “Amore Wifi TP Link,” “Amore Social Care,” and “love2.5” appeared throughout the scan. Together they served as quiet digital reminders that even in the language of Wi-Fi, all you need is love.