

When you finish a site survey in Helsinki, and you have a Sidekick 2 in your backpack and an electric scooter under your feet, what do you do? You go exploring. That’s exactly what we did in Eira, one of the city’s most charming and well-established districts. And while gliding through the streets of this picturesque southern neighborhood, we scanned over 150,000 square meters of urban Wi-Fi.
Our goal: not to fix a problem, but to observe. What does wireless look like in a modern, high-end residential area of a Nordic capital? Which frequencies dominate? Who changes their router’s default name, and who doesn’t? Are Wi-Fi 6E networks already making their way into homes and businesses?
Eira: Where Elegance Meets Connectivity
Eira is known for its seafront villas, art nouveau buildings, and peaceful atmosphere. It’s affluent but not flashy, the kind of place where high-quality infrastructure is expected, but not shouted about. This made it the perfect candidate for a quiet, data-driven Wi-Fi snapshot.
What We Measured
Using the Ekahau Sidekick 2, we conducted a passive walk-through (well, roll-through) survey across the district on 24 September 2024, capturing data on the 2.4 GHz, 5 GHz, and 6 GHz bands. Each Wi-Fi signal source we encountered was logged with its signal characteristics, channel usage, SSID name, and manufacturer data, resulting in thousands of entries to analyze.
Why This Matters
We believe the best way to understand wireless performance is to go where the signals are. These urban surveys offer a unique lens into how everyday users experience Wi-Fi, insights that are often overlooked in lab-based performance tests or ISP marketing claims.
Whether you’re a network engineer, telco strategist, or just a curious techie, these micro-surveys reveal trends that impact connectivity, reliability, and security in real environments.
Here’s what we found.
Total Broadcasts Captured
The signals we recorded came from a range of hardware types, including routers, access points, ISP-issued units, vehicles, and mobile hotspots. For simplicity, we refer to all of these as broadcasting devices. One device can operate on multiple frequency bands and may broadcast several network names (SSIDs) on each. This means the number of SSIDs is typically higher than the number of devices behind them. Throughout this article, we alternate between device-level and SSID-level analysis to provide a full picture of the wireless environment.
During our wireless sweep through Helsinki’s Eira district, we identified a total of 1,878 physical broadcasting devices, each operating on one or more frequency bands. From these devices, we recorded 3,787 individual SSID broadcasts, of which 2,973 were named and 814 were hidden, meaning the network name was not broadcast publicly but the signal was still detectable and analyzed.
Looking at frequency distribution, 1,284 devices operated on the 2.4 GHz band, 1,343 on the 5 GHz band, and 8 on the 6 GHz band. These counts include overlapping usage, as many devices broadcast on more than one frequency.
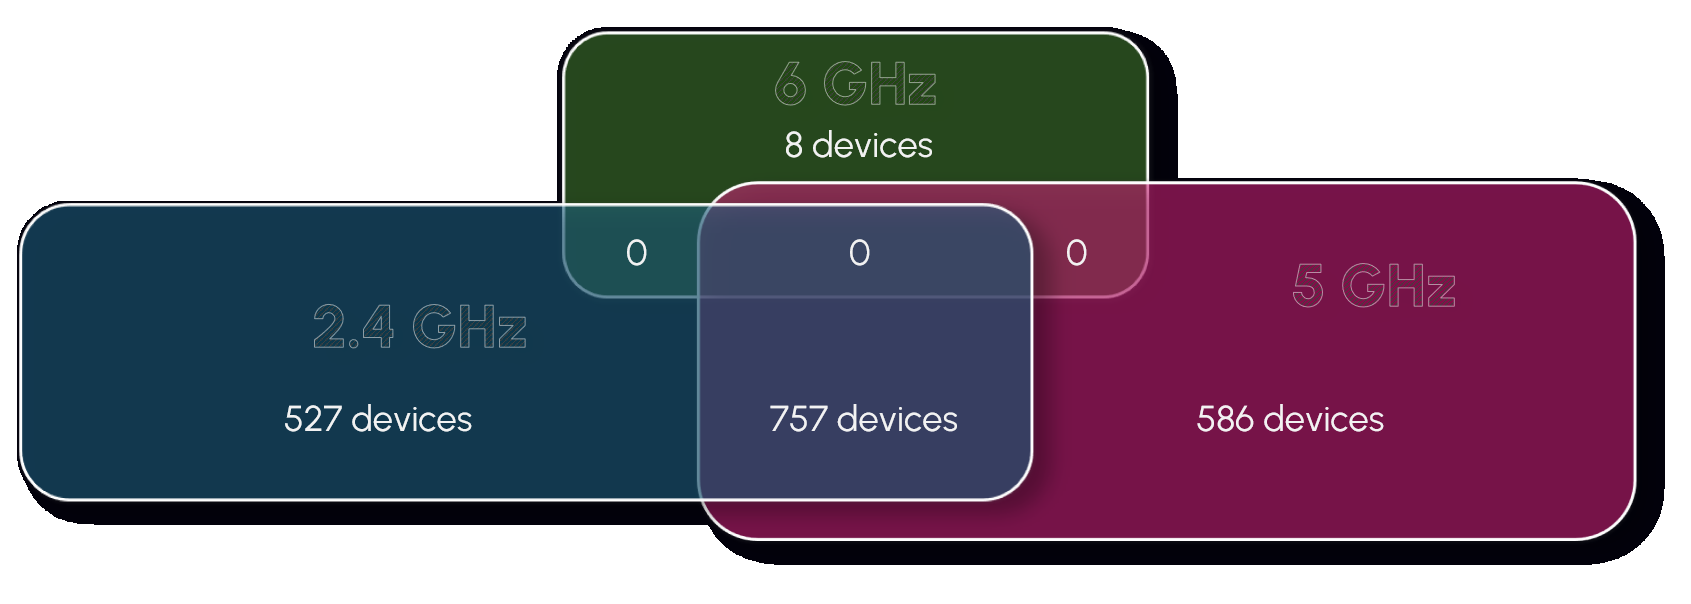
This layered distribution reflects typical urban environments, where older and newer technologies coexist, and where the adoption of high-bandwidth 6 GHz solutions remains extremely limited.
Wi-Fi Technology Versions
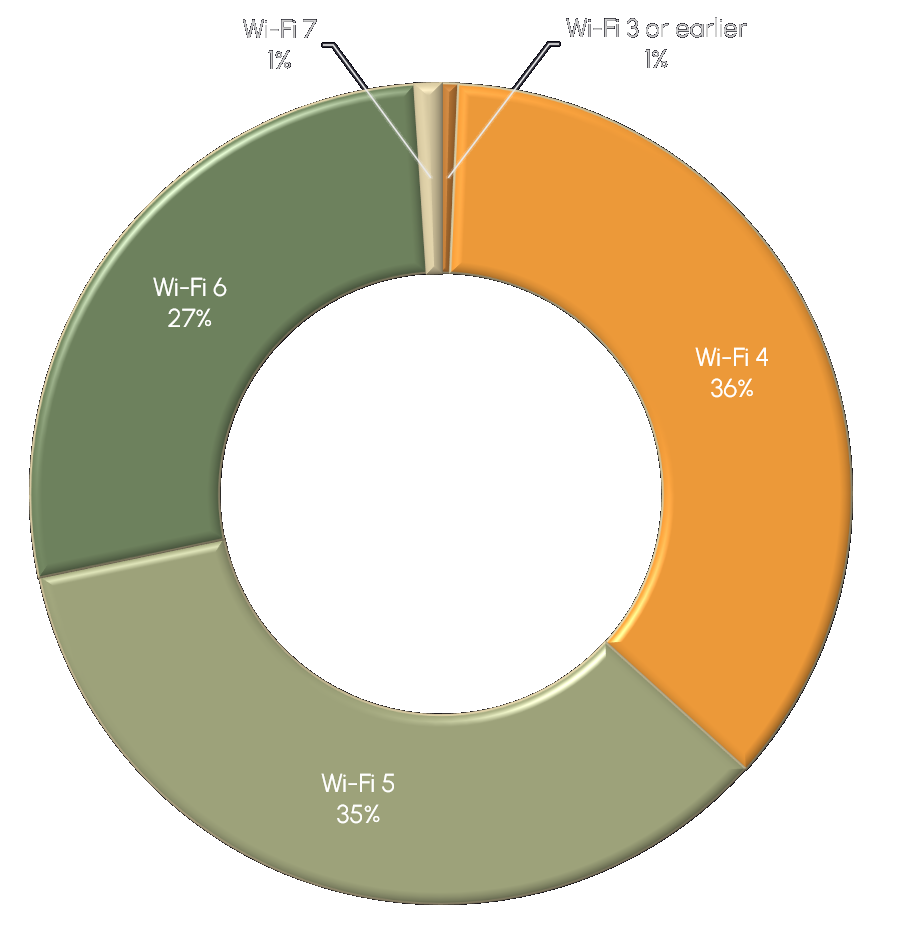
Wi-Fi 4 remains the most widespread technology in Eira, with Wi-Fi 5 and Wi-Fi 6 also showing strong presence across the area. Although Wi-Fi 6E hardware is becoming increasingly available, only a minimal number of SSIDs were observed operating in the 6 GHz band using Wi-Fi 6 technology, suggesting that real-world deployment of Wi-Fi 6E is still in its early stages.
At the same time, the emergence of Wi-Fi 7 broadcasts highlights the beginning of next-generation adoption, even as most networks continue to rely on more established standards. A small portion of legacy SSIDs without a defined technology label also appeared in the scan, likely corresponding to older devices still in use.
Channel Saturation
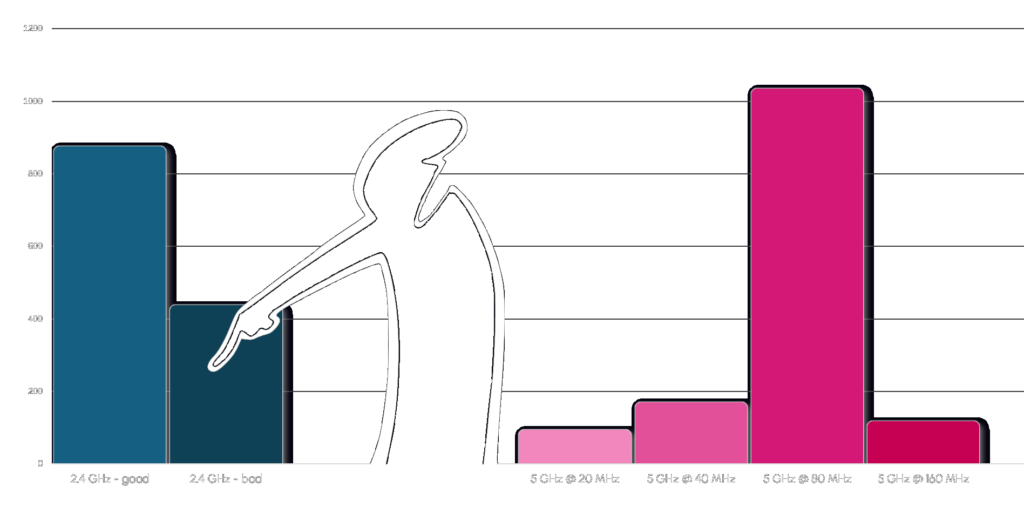
On the 2.4 GHz band, the majority of devices followed industry best practices by using non-overlapping channels (1, 6, or 11) with a 20 MHz channel width. However, a significant portion still deviated from this standard, either by selecting overlapping channels or opting for wider 40 MHz operation. These misconfigurations increase the risk of co-channel and adjacent-channel interference, especially in dense urban environments like Eira. A follow-up article will take a closer look at why the 1, 6, and 11 channel plan with 20 MHz width remains the most reliable setup for 2.4 GHz networks.
In the 5 GHz range, most devices favored wider channel widths, with 80 MHz being the most common configuration. A smaller number used 40 MHz or 160 MHz, and only a few devices remained on 20 MHz. This preference for higher throughput comes at a cost. In congested areas, wide channels can lead to more overlap, reduced spectrum efficiency, and degraded performance.
All 6 GHz transmissions observed operated with 160 MHz channel width, reflecting high-performance, low-interference use cases. However, their extremely limited presence indicates that such setups are still the exception rather than the norm. Interestingly, none of the 6 GHz devices in the dataset were also observed broadcasting on 2.4 or 5 GHz. This does not necessarily mean they lack tri-band capability, it may reflect configuration choices, power-saving behavior, or temporary inactivity of other radios during the scan.
SSID Naming Patterns
The names of Wi-Fi networks offer a window into how users and service providers configure their environments. In Eira, the majority of SSIDs, nearly 80 percent, were broadcast with visible names, while 814 were hidden. These hidden networks do not announce their name publicly, but their presence and signal characteristics were still captured and analyzed. A follow-up article will explore the reasons behind hiding SSIDs and what this means for security and user experience.
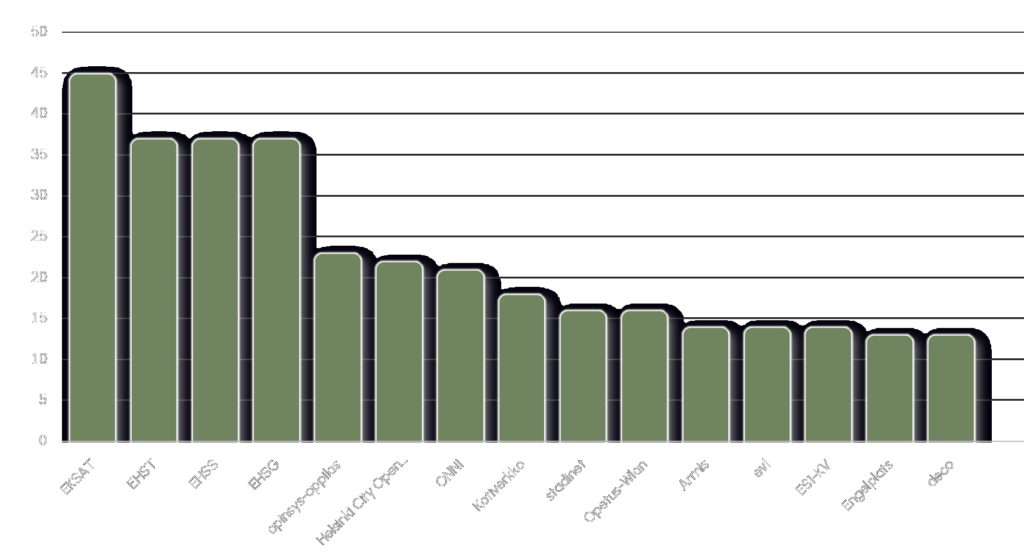
A significant portion of named SSIDs followed patterns typical of service providers and institutional deployments. Common names included EKSAT, Opinsys-Oppilas, Kotiverkko, Helsinki City Open WLAN, and Opetus-Wlan. These networks likely originate from educational institutions, public access services, and default ISP configurations such as DNA-WIFI-B667 or Elisa_Mobi_490F_deco.
Beyond the standardized and institutional names, a handful of SSIDs stood out for their personality. Humor, however, was in short supply. Among thousands of networks, we found only one that made us smile: FBI Surveilance Van #33, a classic Wi-Fi joke with a typo in the word “surveillance.” A fitting metaphor, perhaps, for the understated style of Eira, where even the jokes are low key.
Who’s Powering Eira’s Wi-Fi?
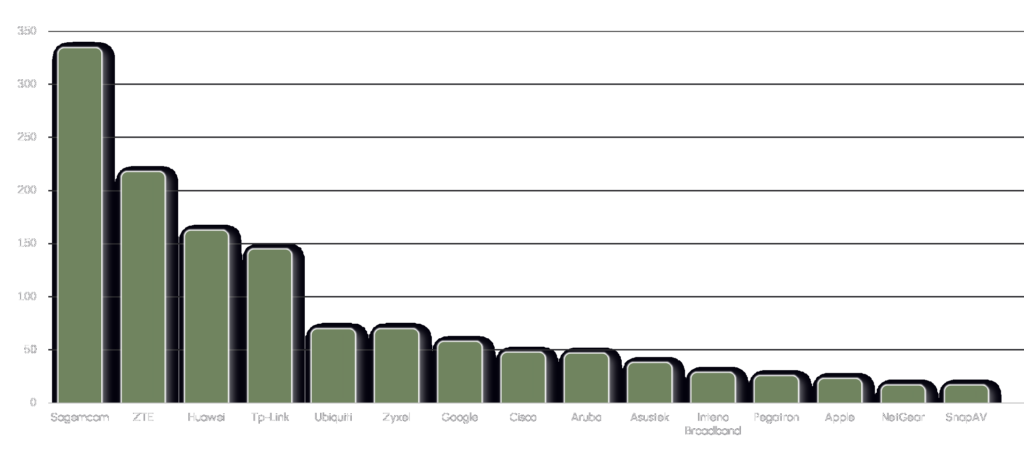
The vast majority of Wi-Fi signals in Eira originated from consumer-grade routers and ISP-issued hardware. Among these, Sagemcom devices were by far the most common, with 329 individual devices observed. ZTE, Huawei, and TP-Link followed closely behind, each contributing significantly to the overall volume of residential networks.
While most manufacturers on the list are associated with mass-market consumer devices, others such as Cisco and Aruba are more typical of enterprise environments. Their presence, alongside Ubiquiti’s, points to a varied mix of deployments, from small businesses and offices to technically inclined home users.
Google and Apple hardware also appeared, though in smaller numbers. Devices like Google Nest and Apple Airport were present, but far from dominant, suggesting that premium consumer solutions are visible yet not widespread in this district.
Overall, the variety of manufacturers detected reflects the layered structure of Eira’s wireless landscape. From default ISP boxes to advanced enterprise access points, everything shares the same crowded spectrum, shaping the complex and often unpredictable experience of urban Wi-Fi.
Closing Thoughts
Helsinki’s Eira district offered a clear snapshot of how residential wireless networks are evolving. The data reveals a layered environment where outdated standards, ISP defaults, and emerging technologies all coexist.
What stood out most was the extremely low presence of 6 GHz signals. Despite growing support in modern devices, real-world adoption of Wi-Fi 6E and Wi-Fi 7 remains minimal, limited mainly to high-end or enthusiast hardware.
What we found in Eira is not unique. Similar patterns are likely present in urban neighborhoods across Europe. As Wi-Fi becomes a critical part of everyday operations, these insights can help both businesses and service providers make informed decisions about design, deployment, and optimization.
Want to See What Wi-Fi Looks Like in Other Cities?
This article is part of an ongoing series. We’ll be publishing similar reports from across Europe, including Edinburgh, Porto, Paris, and beyond.
What’s more, we’re taking requests. If there’s a place you think we should scan next, let us know, and we might just roll through with the Sidekick.
Follow us on LinkedIn or sign up for our newsletter to get the next one straight to your inbox. And if you’d like to see what’s going on inside your network, we’re just a message away.