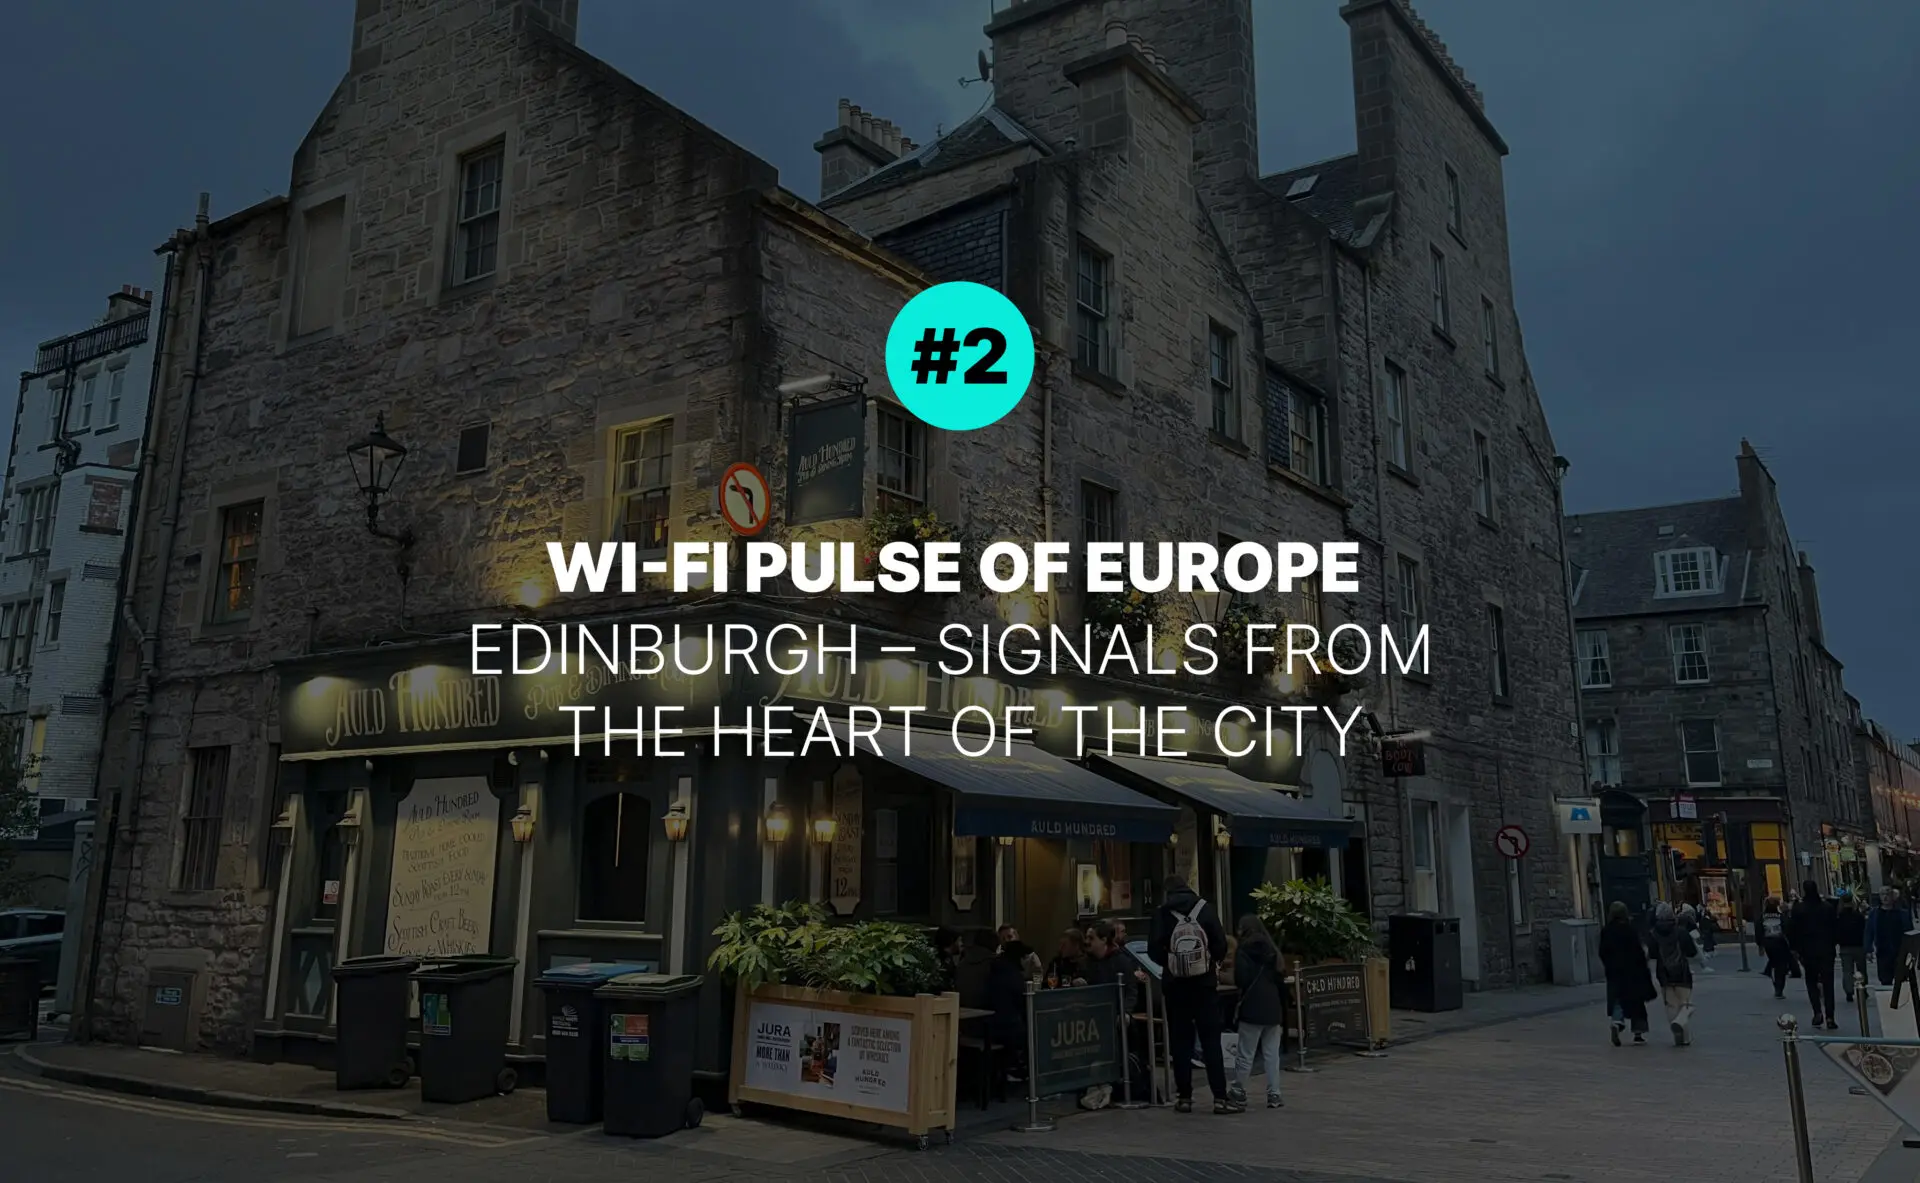
After surveying the elegant calm of Helsinki’s Eira district by electric scooter, we shifted gears and headed to a very different environment. Edinburgh’s historic city centre is dense, lively, and full of architectural charm, with Wi-Fi signals bouncing between cafés, offices, shops, and homes. It is a place where public and private wireless networks coexist in close quarters.
Unlike our scooter-based surveys, this one was conducted entirely on foot, limiting the area we could cover. As a result, the roughly 40,000 square meters we surveyed represent a smaller, but even more concentrated, slice of urban wireless life. The measurements took place on 11 October 2024, using our Ekahau Sidekick 2 to capture data across the 2.4 GHz, 5 GHz, and 6 GHz bands. Thousands of signals were logged in just a few hours.
In this article, we break down what we found and what it reveals about wireless infrastructure in the heart of Scotland’s capital.
Total Broadcasts Captured
The signals we recorded came from a variety of hardware types. In a dense urban setting like Edinburgh’s city centre, most of them originated from fixed infrastructure such as home or office routers, Wi-Fi access points in cafés or shops, and modem-router units issued by internet service providers. We also detected a small number of signals that likely came from vehicles or mobile hotspots, including in-car Wi-Fi systems and smartphone tethering. For simplicity, we refer to all of these as broadcasting devices.
In wireless analysis, it’s important to distinguish between physical devices and Wi-Fi networks (SSIDs). A single physical device can operate on multiple frequency bands and may broadcast several SSIDs on each band. As a result, the number of SSIDs recorded in a survey is typically higher than the number of broadcasting devices behind them.
Throughout this article, we switch between device-level and SSID-level observations depending on what the analysis calls for. Both views reveal important aspects of wireless environments, and together they offer a complete picture of how networks behave in the real world.
In total, we detected 1,222 broadcasting devices. These emitted 3,809 SSIDs, of which 2,678 were named and 1,131 were hidden.
Looking at frequency distribution, 826 devices operated on the 2.4 GHz band, 800 on the 5 GHz band, and only 7 on the 6 GHz band. These counts include overlapping usage, as many broadcasting devices operate on more than one frequency band.
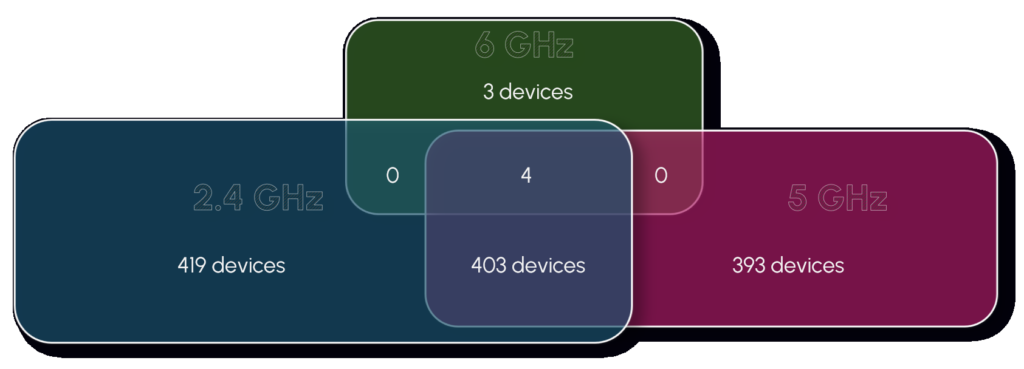
This distribution reflects the layered nature of wireless deployments in dense urban environments, where legacy and modern technologies are used side by side, and where the adoption of 6 GHz solutions is still in its early stages.
Wi-Fi Technology Versions
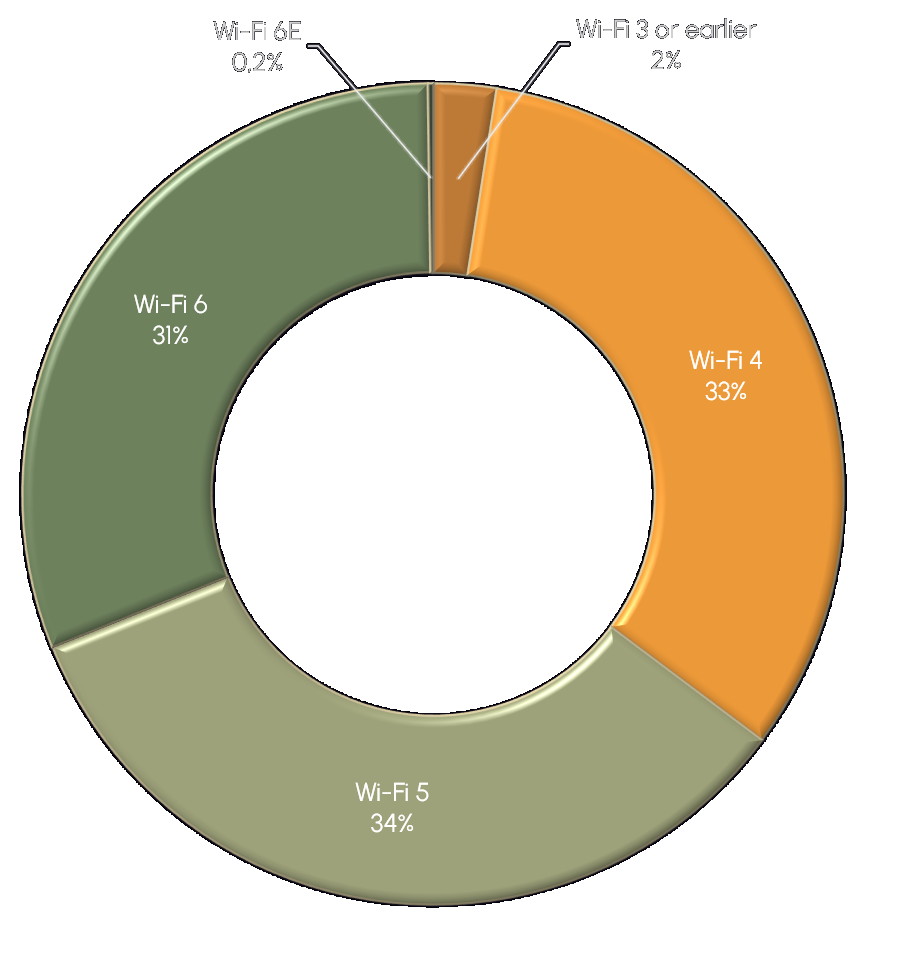
In Edinburgh’s city centre, Wi-Fi 4, 5, and 6 were the dominant technologies observed across SSID broadcasts, with a fairly even distribution between them. Wi-Fi 5 appeared most frequently, followed closely by Wi-Fi 4 and Wi-Fi 6. This suggests that while many networks still rely on earlier hardware, more recent standards are already widely adopted and actively used.
The overall balance between Wi-Fi 4, 5, and 6 in Edinburgh closely mirrors what we previously observed in Helsinki’s Eira district, indicating a consistent pattern in the uptake of these mid-generation technologies across different European urban environments.
Wi-Fi 6E was detected only in a few isolated cases, and no Wi-Fi 7 broadcasts were observed at all. This confirms that tri-band and next-generation deployments remain rare in real-world environments, even in tech-heavy urban areas.
Channel Saturation
On the 2.4 GHz band, 702 broadcasting devices followed recommended configuration practices by using one of the non-overlapping channels (1, 6, or 11) with a standard 20 MHz channel width. Another 124 devices diverged from this setup, either by selecting overlapping channels, using a 40 MHz width, or both. These misconfigurations increase the risk of interference, especially in dense urban environments.
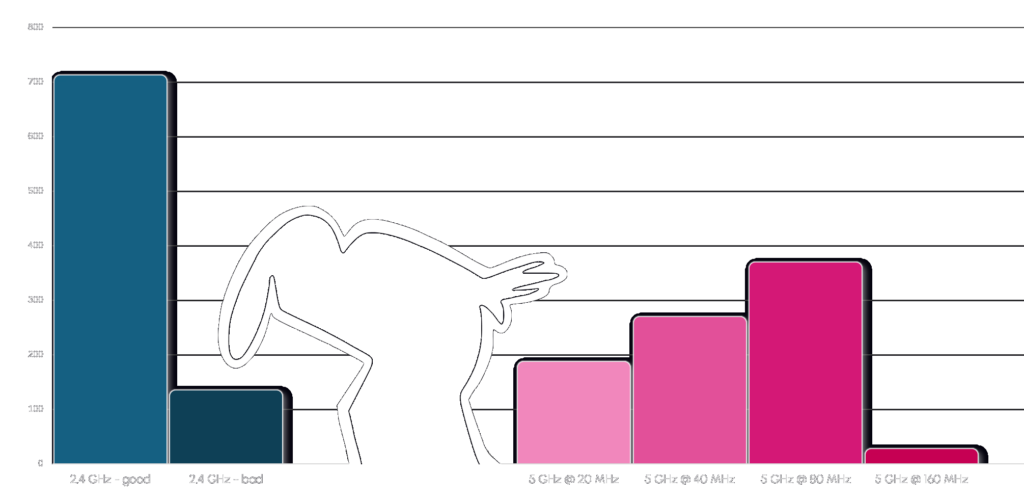
On the 5 GHz band, a variety of channel widths was observed. 359 devices operated with 80 MHz channels, making it the most common configuration. 259 devices used 40 MHz, and 177 used 20 MHz. Only 17 devices operated on 160 MHz, indicating that performance-focused setups remain uncommon. The overall distribution suggests a strong presence of factory-default configurations and limited use of advanced tuning.
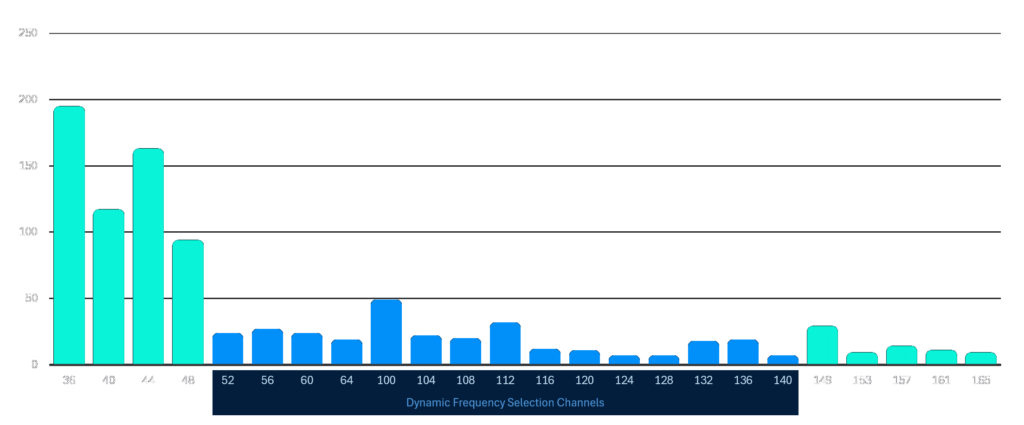
Channel usage was heavily concentrated in the lower parts of the 5 GHz spectrum. Channels 36, 40, 44, and 48 accounted for the majority of deployments, with channel 36 alone used by 191 devices and channel 44 by 159 devices. Mid-band DFS channels, highlighted in blue on the chart below, and higher-frequency channels were used in roughly equal numbers and showed moderate activity. This pattern reflects both regulatory constraints and user preference for channels that minimize device compatibility issues and avoid DFS-related delays.
The 6 GHz band was sparsely populated. Only 7 devices were detected operating in this range, all of them using a 160 MHz channel width. While this demonstrates that upper-band capability exists in some deployments, actual usage remains very limited.
If you’re unsure whether your wireless setup is following these principles, we can help design a configuration that works better for your specific environment.
SSID Naming Patterns
The vast majority of SSIDs we recorded in Edinburgh’s city centre were associated with commercial activity. Businesses, shops, restaurants, hotels, bars, and various institutions dominated the wireless landscape. From guest networks in boutique hotels to public Wi-Fi in cafés and pubs, the naming patterns revealed a dense and service-focused urban environment.
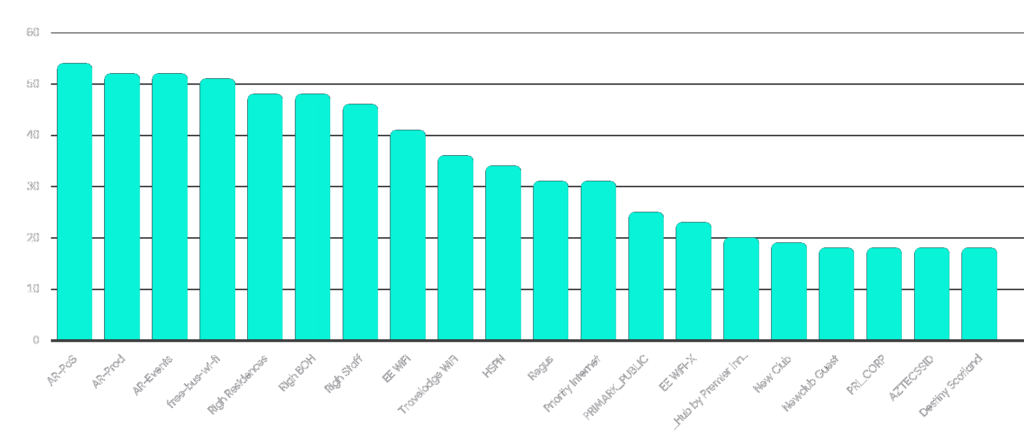
Humorous or personalized SSIDs were rare. Unlike in some residential surveys, we did not encounter pun-based or ironic network names that often reflect a more playful or individual approach to wireless configuration.
A handful of SSIDs appeared to originate from vehicles, typically from infotainment systems or portable hotspots. These included names like:
- Audi_MMI_5559_5GHz
- MINI34906 CarPlay
- MyVolvoYWsenN
- BMW 34717 CarPlay
- My SEAT 6215
We also encountered a curious SSID composed of characters from several different Asian writing systems: ခ།ဖꪆᰈᮀ།. It includes elements from Burmese, Tai Tham, Batak, and Sundanese scripts, forming a string with no apparent meaning in any single language. Some claim it is pronounced Amaran, but this interpretation is not linguistically grounded and likely reflects personal intent rather than actual translation.
Another notable outlier was *:・゚✧*:・゚✧ qishy, a stylized name that stood out for its expressive formatting. It was the only example we found that hinted at a personal or aesthetic choice behind the network name.
As for the creative and technical possibilities of SSID naming, it’s worth noting that Wi-Fi networks can use a wide range of Unicode characters, including emojis and scripts from many writing systems, provided they fit within the technical limits of 32 bytes. Some clients may not display them correctly, and there are edge cases where compatibility issues arise. We’ll explore this topic more deeply in a separate article dedicated to what kinds of characters can be used in SSID names, and how far you can push the limits.
Who’s Powering Edinburgh’s Wi-Fi?
The wireless landscape in Edinburgh’s city centre is supported by a diverse range of hardware manufacturers, reflecting a mix of enterprise-grade infrastructure, ISP-provided equipment, and individually installed systems. In many cases, the manufacturer could be identified through information embedded in the beacon frame or inferred from the device’s MAC address. However, this was not always possible. Devices using randomized or incomplete broadcast identifiers, or those with missing manufacturer tags, remained unclassified, meaning the true vendor distribution is only partially visible in the data.
Among the devices where a vendor could be identified, the most common manufacturer by a wide margin was Ubiquiti, with 184 broadcasting devices detected. Known for its scalability and ease of deployment, Ubiquiti equipment is a popular choice among small businesses, service providers, and technically inclined users.
Closely following was Cisco Meraki, with 169 devices. As a cloud-managed enterprise solution, Meraki’s strong presence suggests a significant number of corporate, retail, and hospitality deployments throughout the city centre.
Other enterprise-grade vendors also featured prominently, including Cambium, Lancom, Cisco, Aruba, and Ruckus Wireless. Together, they indicate widespread use of professional wireless infrastructure in environments where performance and centralised management are a priority.
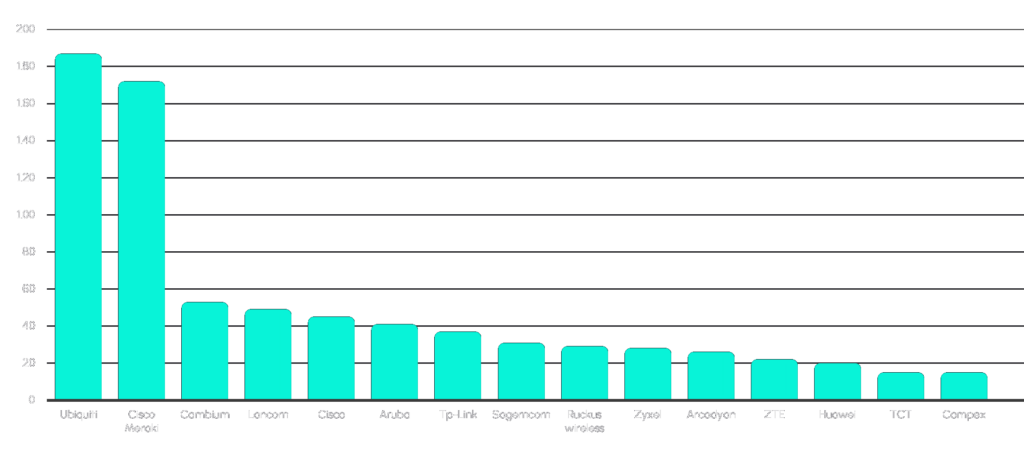
Consumer and ISP-related brands were also visible, though in smaller numbers. TP-Link, Zyxel, ZTE, Huawei, and Sagemcom each contributed a portion of the total, typically representing residential or small office routers, or ISP-issued modem-router units.
The appearance of manufacturers like Arcadyan, TCT, and Compex rounds out a picture of a layered wireless environment, where premium enterprise gear coexists with more affordable or preconfigured alternatives. This vendor distribution supports the impression of a commercially dense urban zone, where professional-grade networking solutions are the norm, but not the rule.
Closing Thoughts
The wireless environment in Edinburgh’s city centre illustrates the complexity of connectivity in a high-density urban setting. With over 1,200 broadcasting devices and nearly 4,000 SSIDs recorded, the area presents a detailed view of how wireless infrastructure is deployed across businesses, institutions, vehicles, and personal devices operating side by side.
Most networks relied on mid-generation Wi-Fi standards such as Wi-Fi 4, 5, and 6, with only a few examples of Wi-Fi 6E and no Wi-Fi 7 at all. This reflects a typical stage in technological adoption, where newer capabilities are present but not yet widespread.
SSID naming was mostly professional and functional, consistent with the commercial nature of the surroundings. Personal, humorous, or creative names were rare.
The signals we captured came from a wide mix of hardware, from enterprise-grade access points to consumer routers and vehicle-based or mobile hotspots. This variety reinforces the idea that real-world wireless environments are layered and diverse, shaped by both design choices and circumstantial constraints.
As cities continue to evolve digitally, surveys like this offer a snapshot of how wireless infrastructure adapts, expands, and coexists in public and private space.
Our next stop takes us west to Liverpool, where we’ll explore the legendary Cavern Quarter, a place rich in musical history and cultural energy. Beneath the brick arches and neon signs, we’ll take a closer look at how wireless networks perform in one of the UK’s most iconic urban districts.
What’s more, we’re taking requests. If there’s a place you think we should scan next, let us know, and we might just roll through with our spectrum analyzer.
Follow us on LinkedIn or sign up for our newsletter to get the next one straight to your inbox. And if you’d like to see what’s going on inside your network, we’re just a message away.

